
Reports: “Existing” Interactions Report

An Existing Interaction Report has multiple use cases:
Location Demand Estimates for store sales forecasting
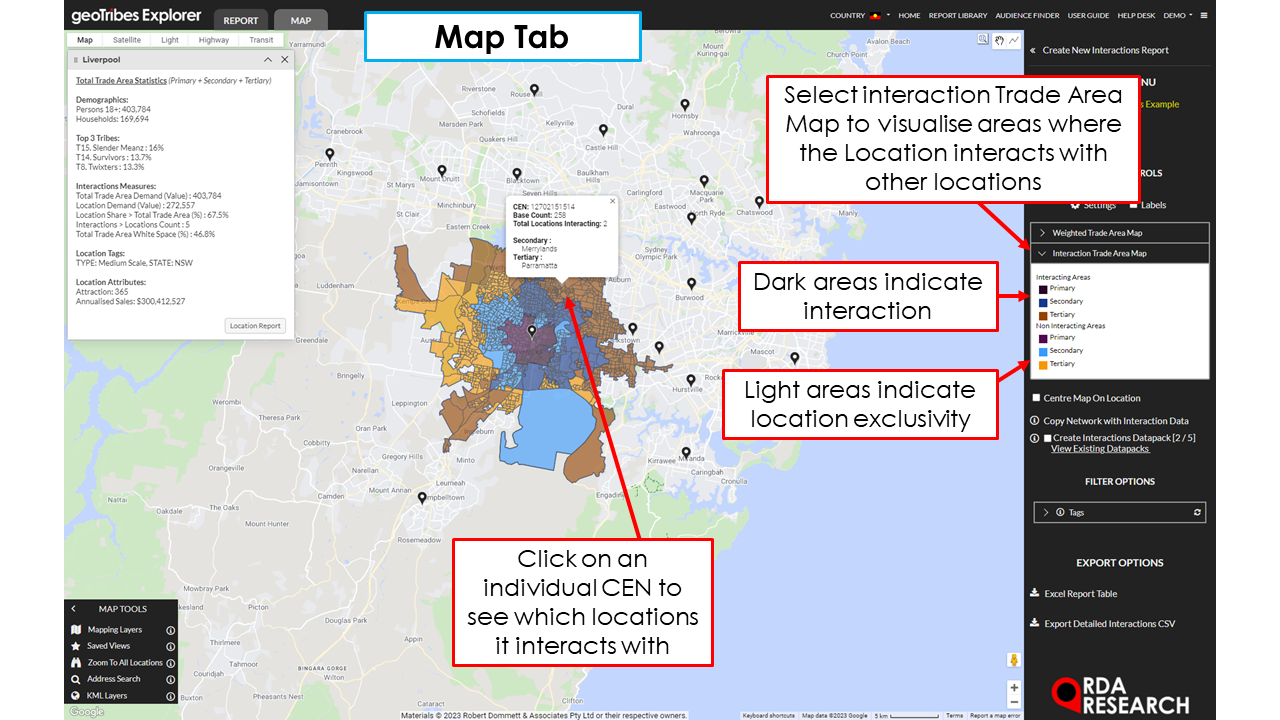
Level of interaction between locations
White Space Analysis
This Report will be broken into 3 steps:
How to Create an Existing Interaction Report
Understanding an Existing Interaction Report
Creating a White Space Analysis
What you will need
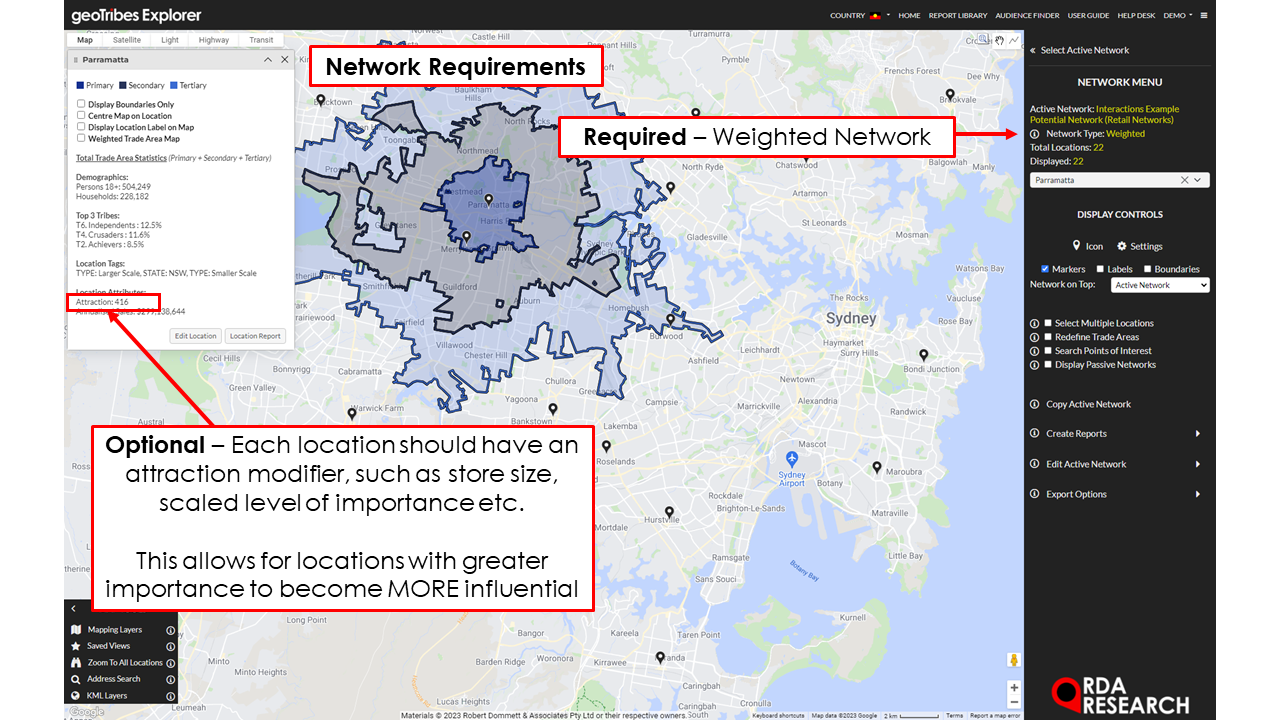
A weighted network - This network should consist of all store locations relevant to the user. This weighted network can be created through “Redefining Trade Areas” or created by RDA.
Optional - Will improve your Reports capabilities:
Attractiveness parameter - This provides a way of scaling the importance of a location based on external site specific factors. For example consumers can be influenced by factors such as store size or shopping centre quality (MAT, GLA, etc.).
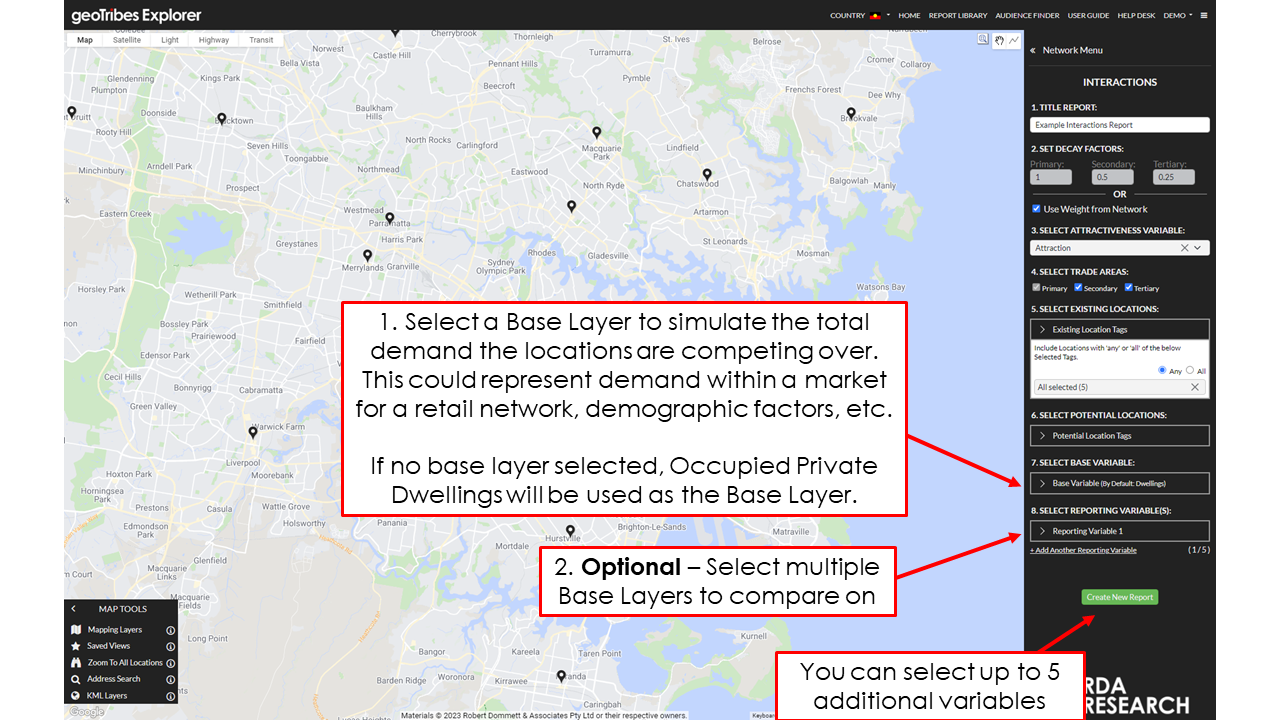
A Base Layer - The demand the locations are competing over, for example population, modelled market ($) etc. Leaving this as the default base layer uses occupied private dwellings as the demand.
Create Interactions Report
To create an Existing Interactions Report:
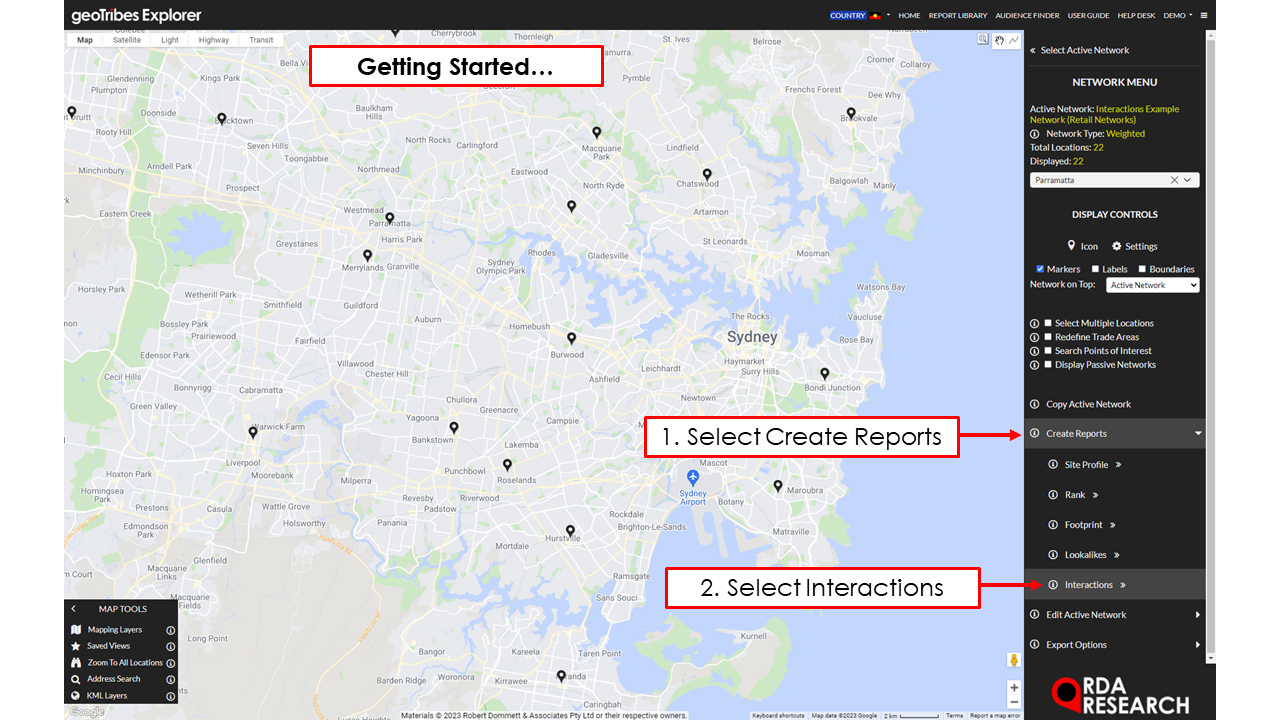
Select your Weighted Network to perform Interactions on.
Select 'Create Reports' then 'Interactions'
Follow the on-screen instructions to set the Report details:
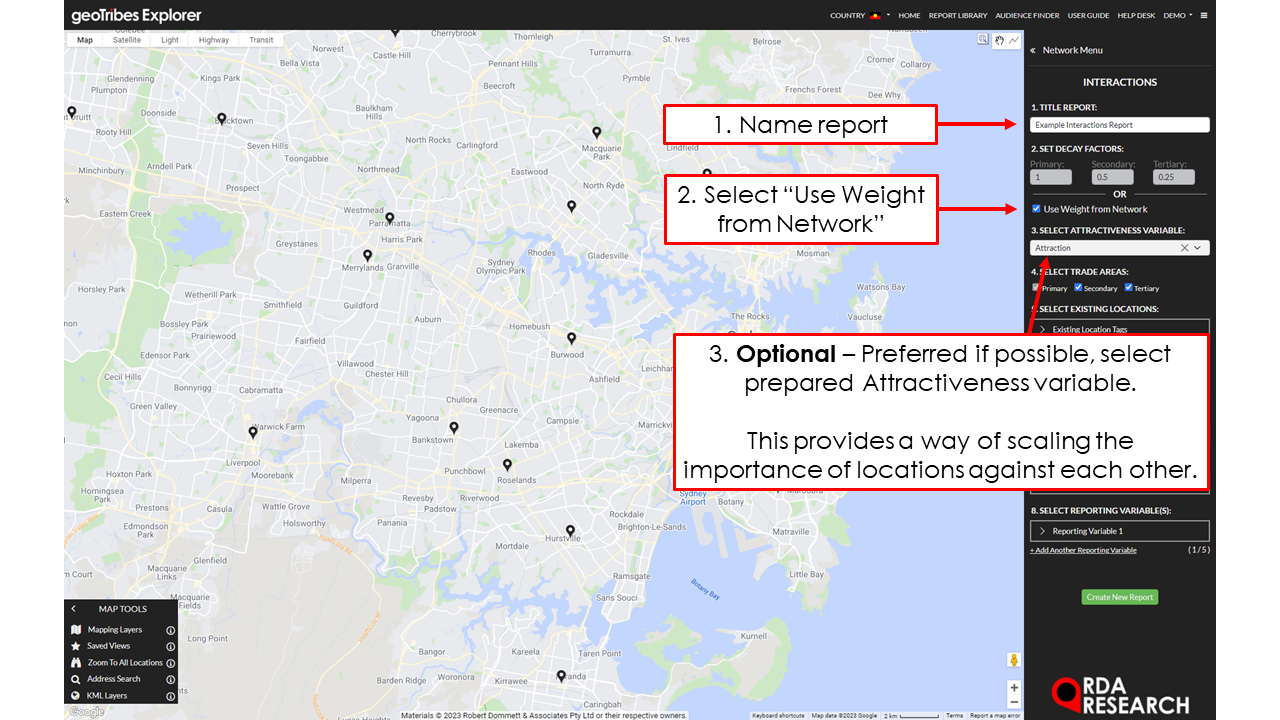
1. Title Report - Name your report so it can be identified from the Report Library later (this can be edited inside the Report and Report Library).
2. Set Decay Factors - Check on “Use Weight From Network”
3. Select Attractiveness Variable (OPTIONAL) - Assign your attractiveness parameter (A Location Attribute prepared earlier)
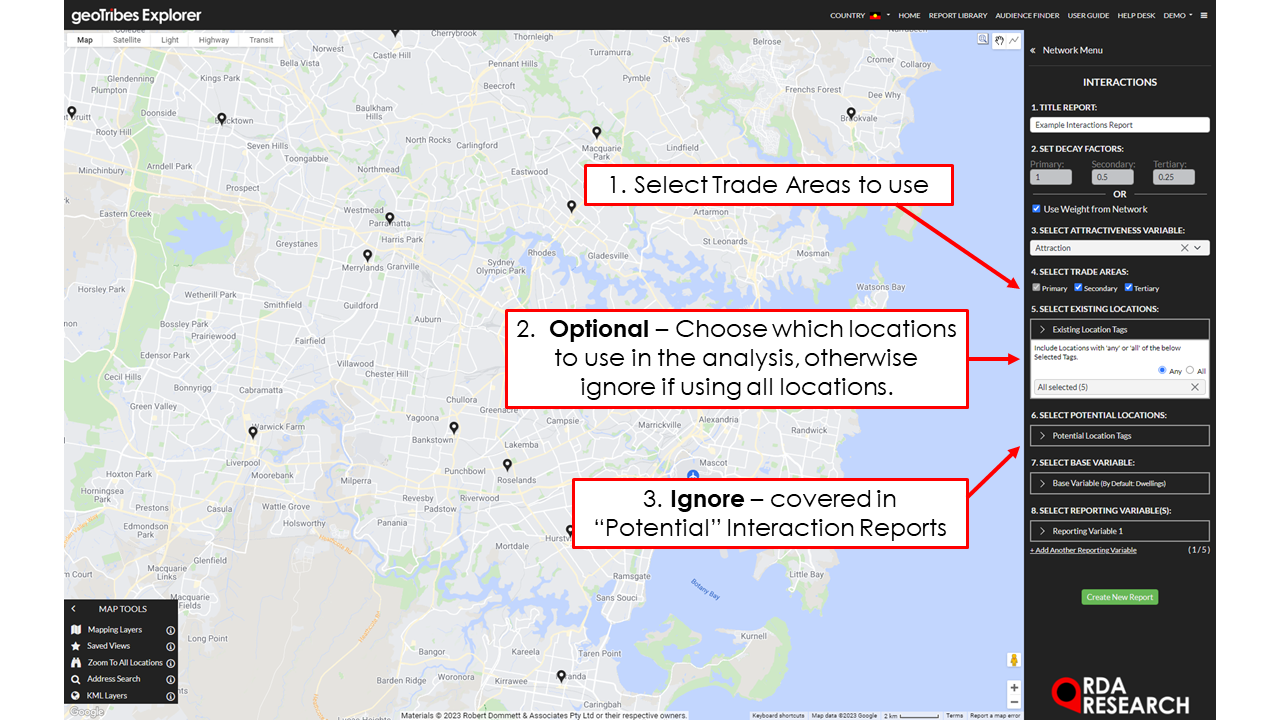
4. Select Trade Areas (IGNORE) - Select which Trade Areas are to be used to determine influence.
5. Select Existing Locations - Filter relevant locations to use in the interactions report.
6. Select Potential Locations (IGNORE) - Not used for this report, explored in “Potential” Interaction Reports
7. Select Base Variable (OPTIONAL) - Determine what the Base Layer will be for the report, this provides the demand the locations will be interacting over. If no Base Layer is selected, the default layer used is Occupied Private Dwellings.
8. Select Reporting Variable (OPTIONAL) - Add additional layers to be included in the analysis.
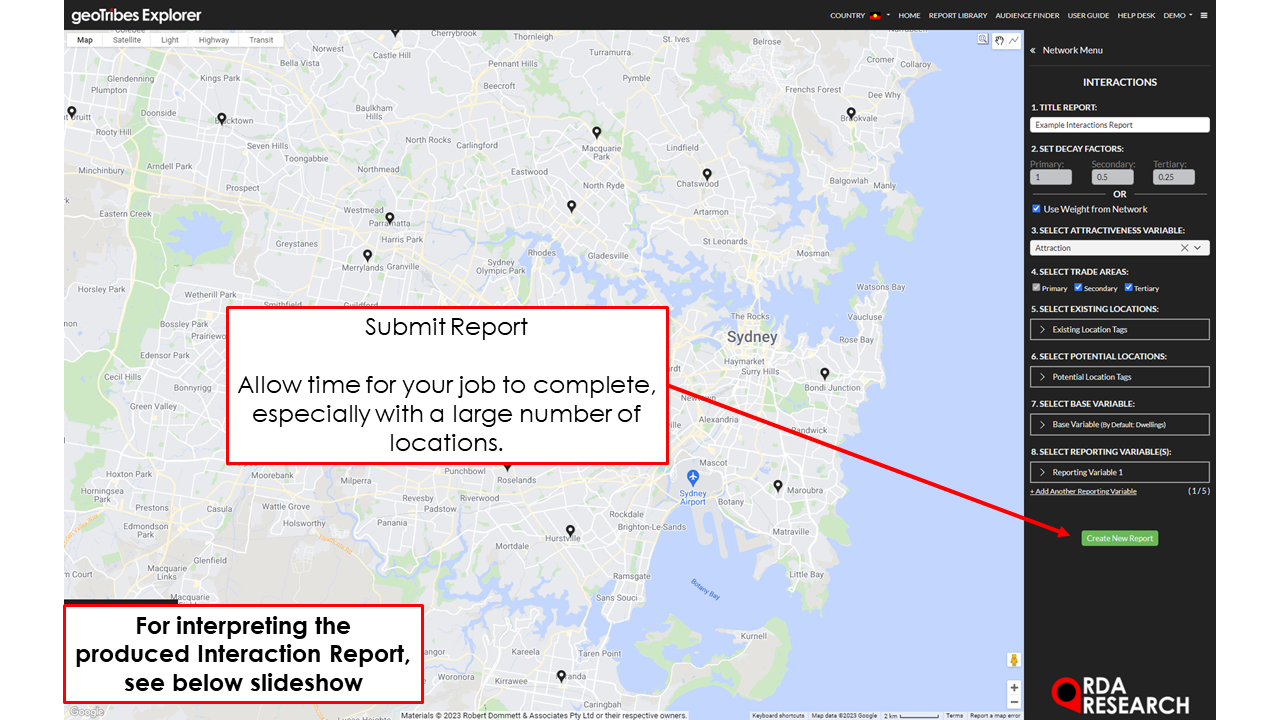
Click 'Create Report' to generate Report.
Understanding an Existing Interactions Report
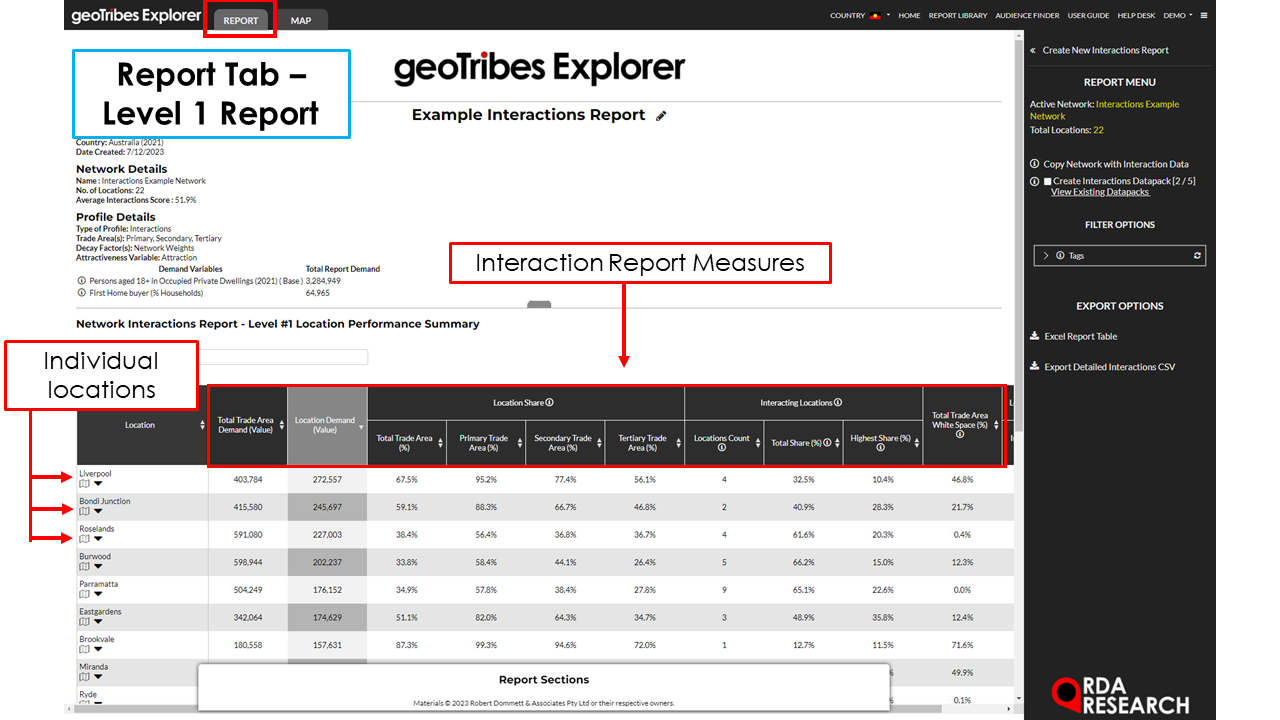

The Report Table comprises the included Network Locations (rows) and a range of Interaction measures (columns).
There are two levels to the Report Tab:
Level 1 - Location Performance Summary
Level 2 - Interacting Locations Listing
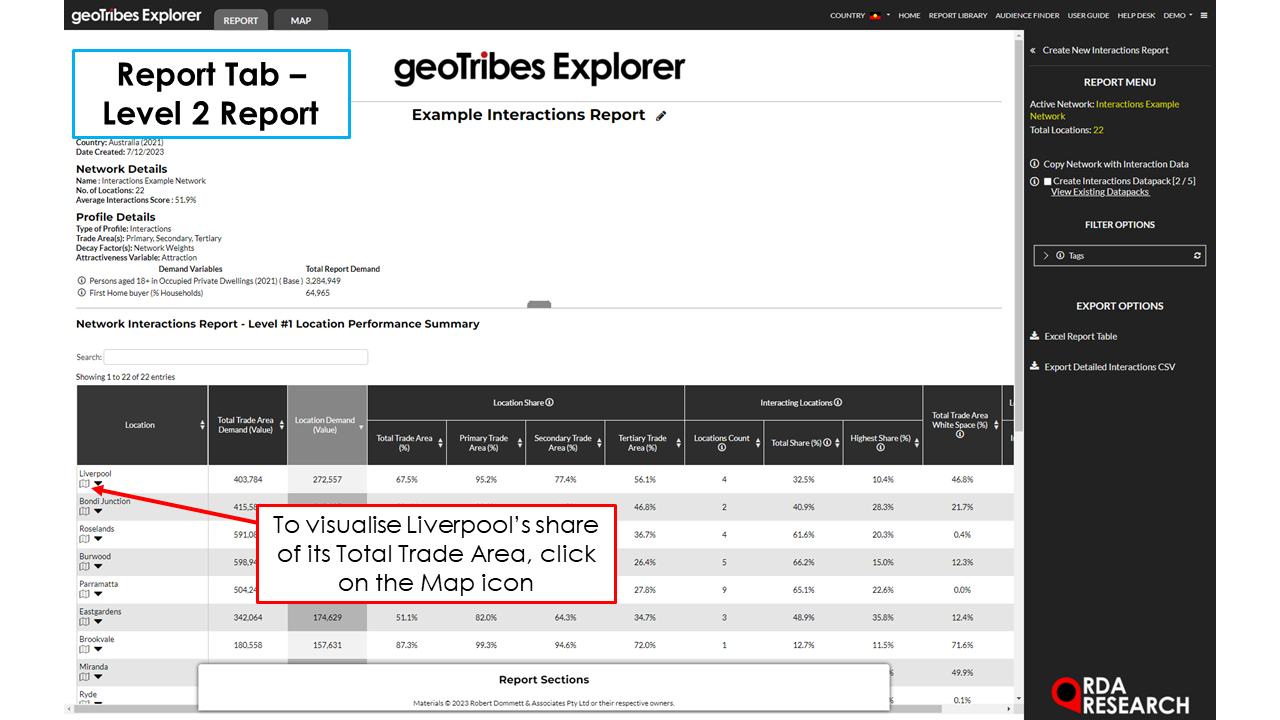
Level 1 - Location Performance Summary
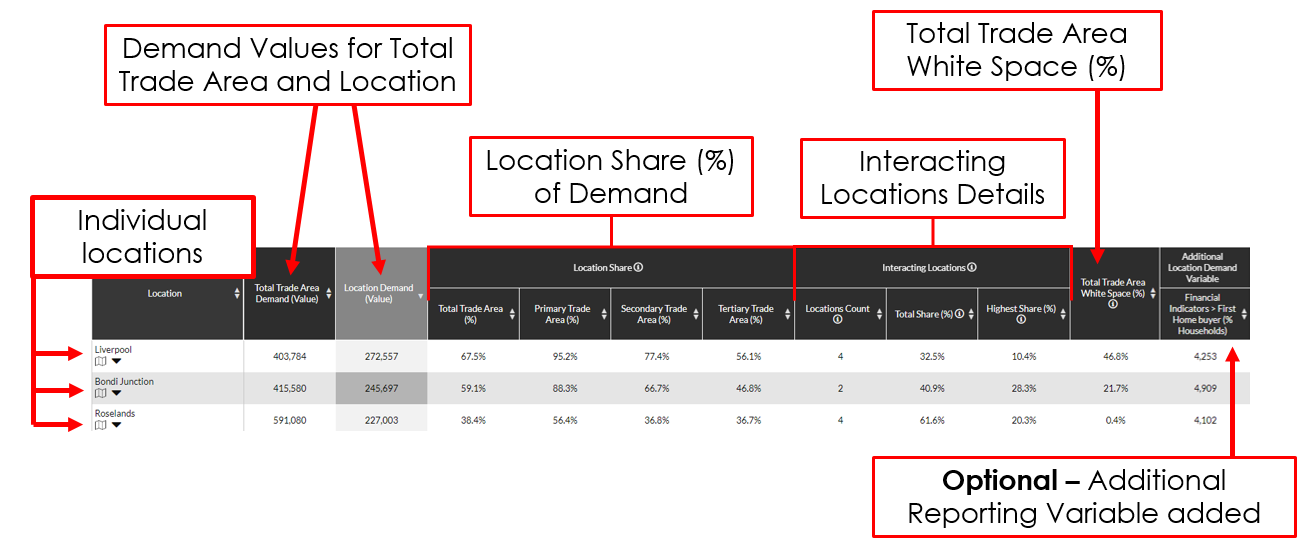
For this Level within the Report Tab, each row represents a location. Each row includes:
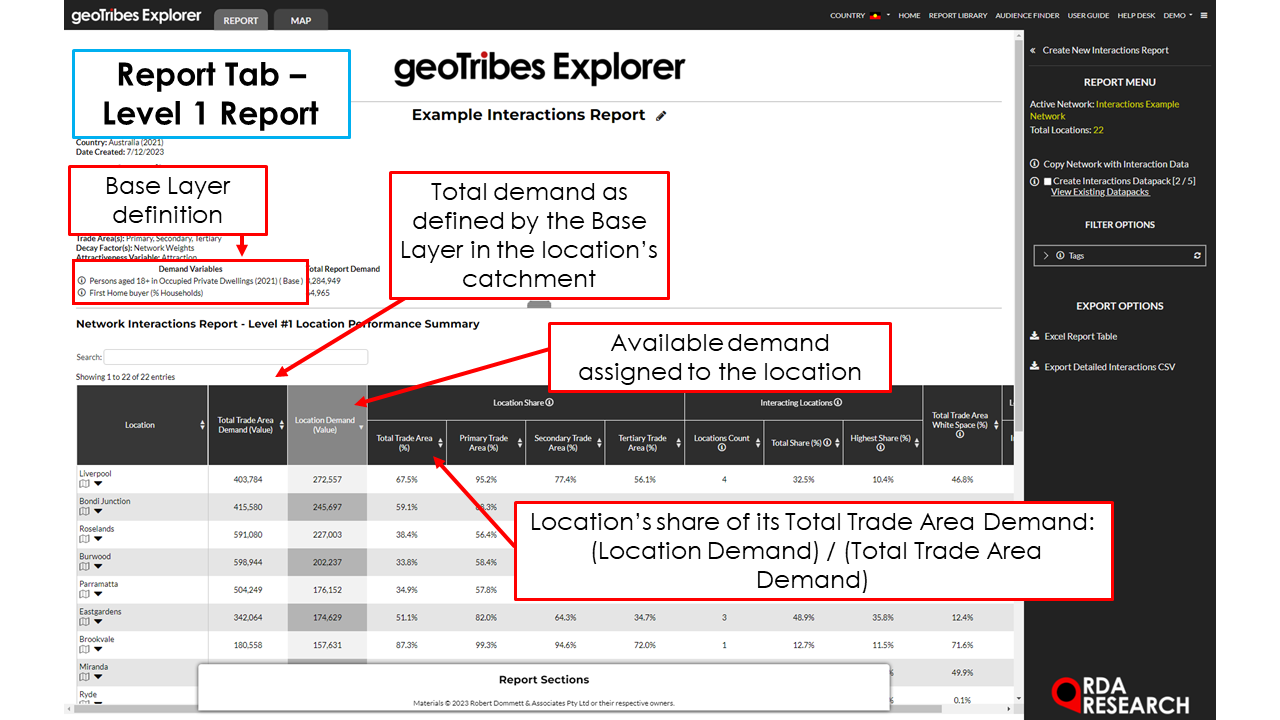
Total Trade Area Demand (Value): Measures the total demand in a location’s Trade Area.
Location Demand (Value): Measures the demand assigned to the location.
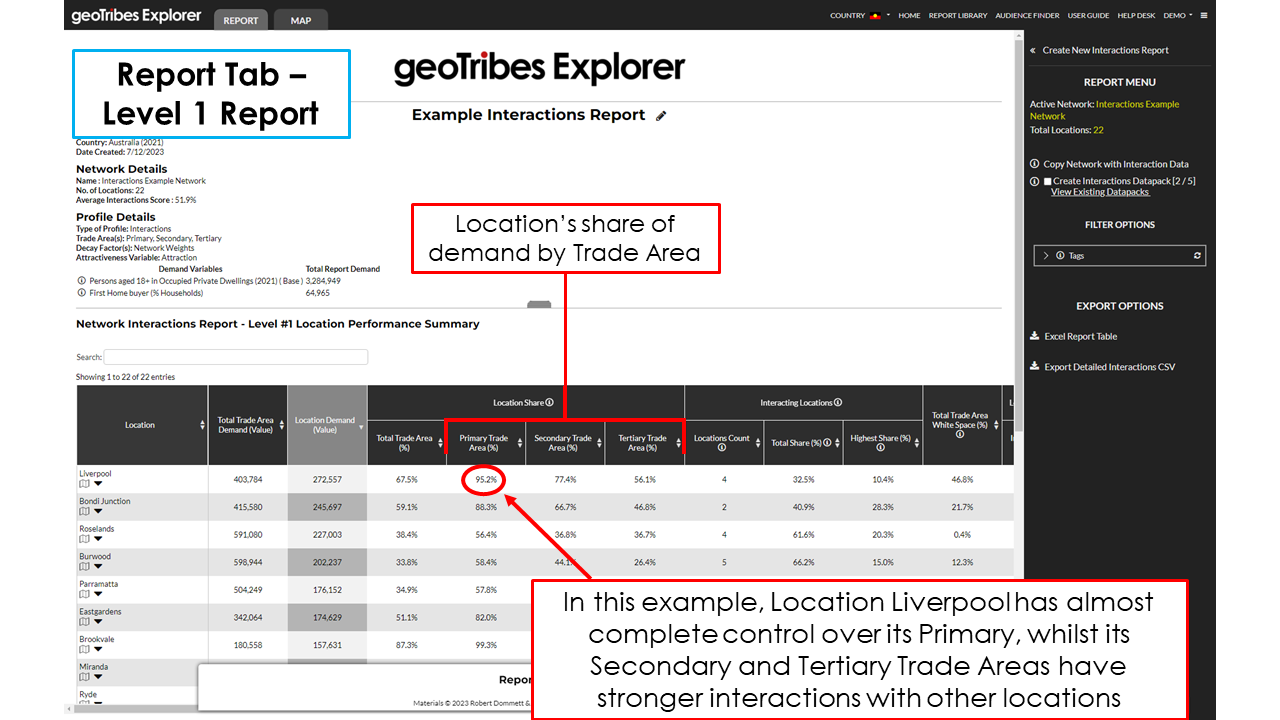
Location Share (%):
Total Trade Area: Shows the the share of Location Demand which is extracted from its Trade Area
Primary, Secondary and Tertiary Trade Area: Shows the share of Location Demand BY Trade Area, useful in determining how close interacting locations are..
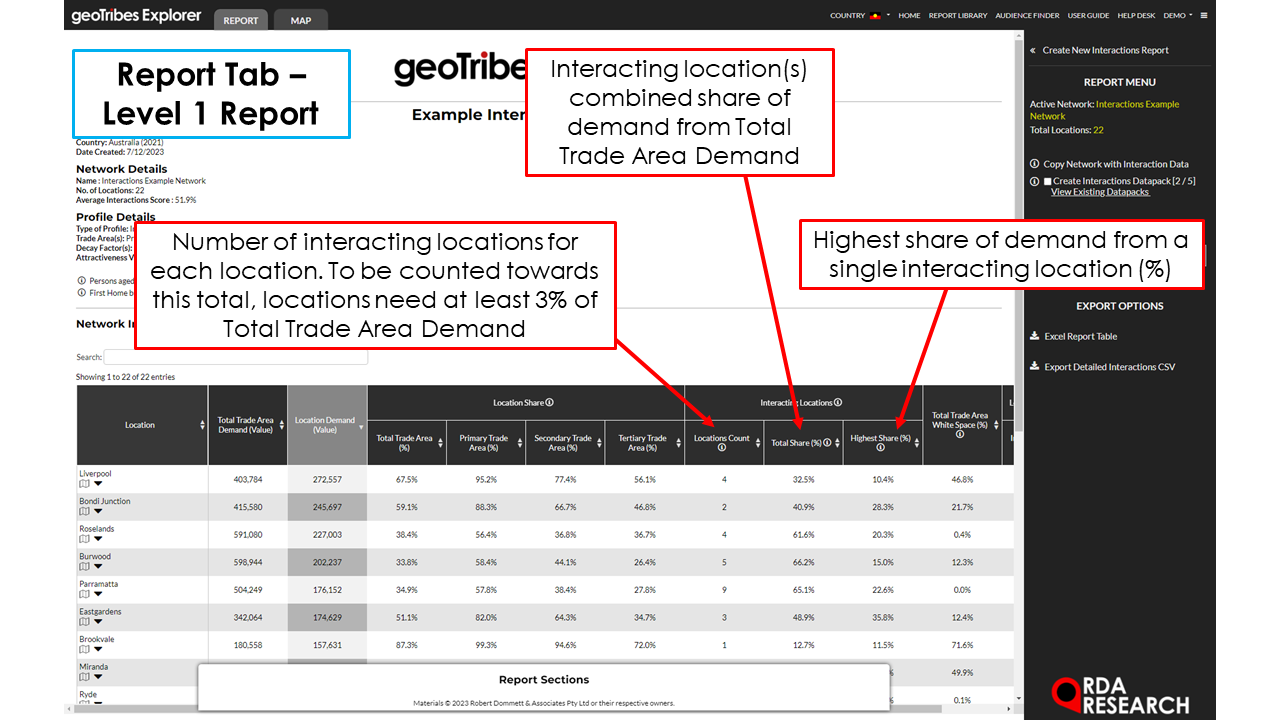
Interacting Locations Details:
Locations Count: Provides a count of Interacting locations that occupy more than 3% of the location’s Total Trade Area Demand.
Total Share (%): Provides the combined share of Total Trade Area Demand assigned to Interacting Locations.
Highest Share (%): Provides the highest share of Total Trade Area Demand from an Interacting Location.
Total Trade Area White Space (%): Measures the proportion of the location’s Total Trade Area Demand which has no interaction (exclusive coverage by the location).
Additional Reporting Variables (OPTIONAL): Measures the demand each location extracts for any additional Reporting Layers (if any were selected).
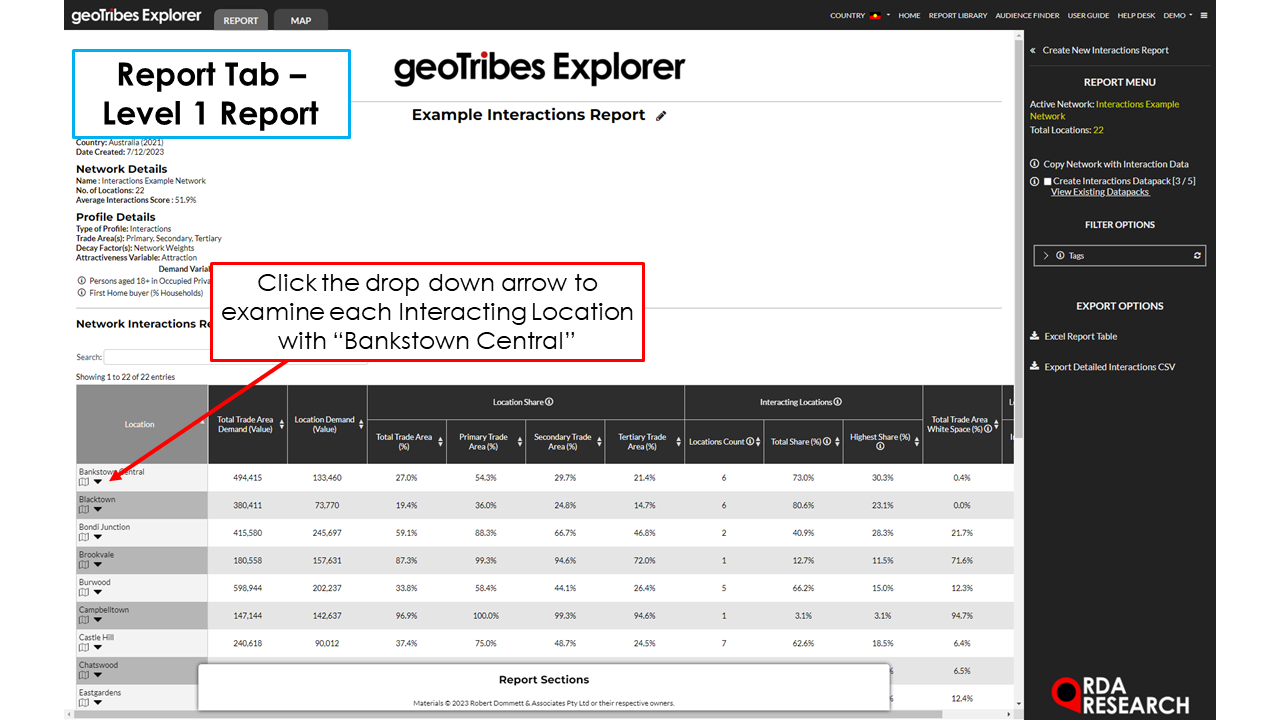
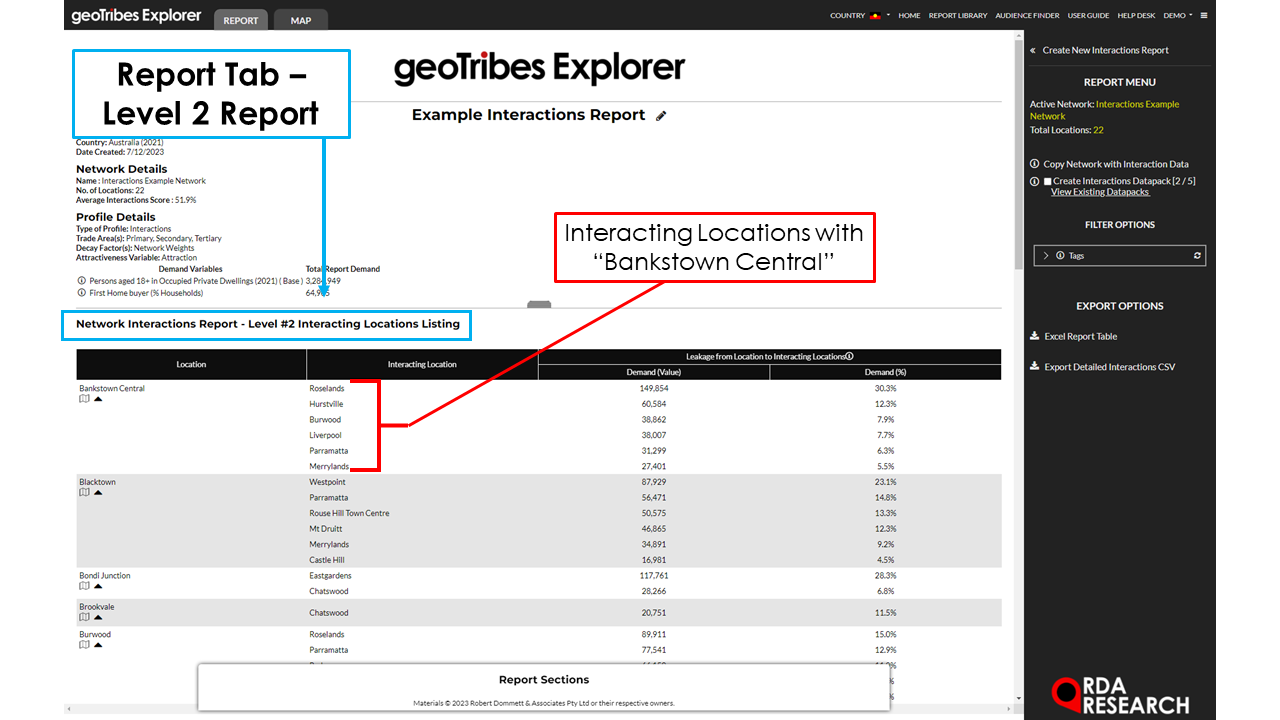
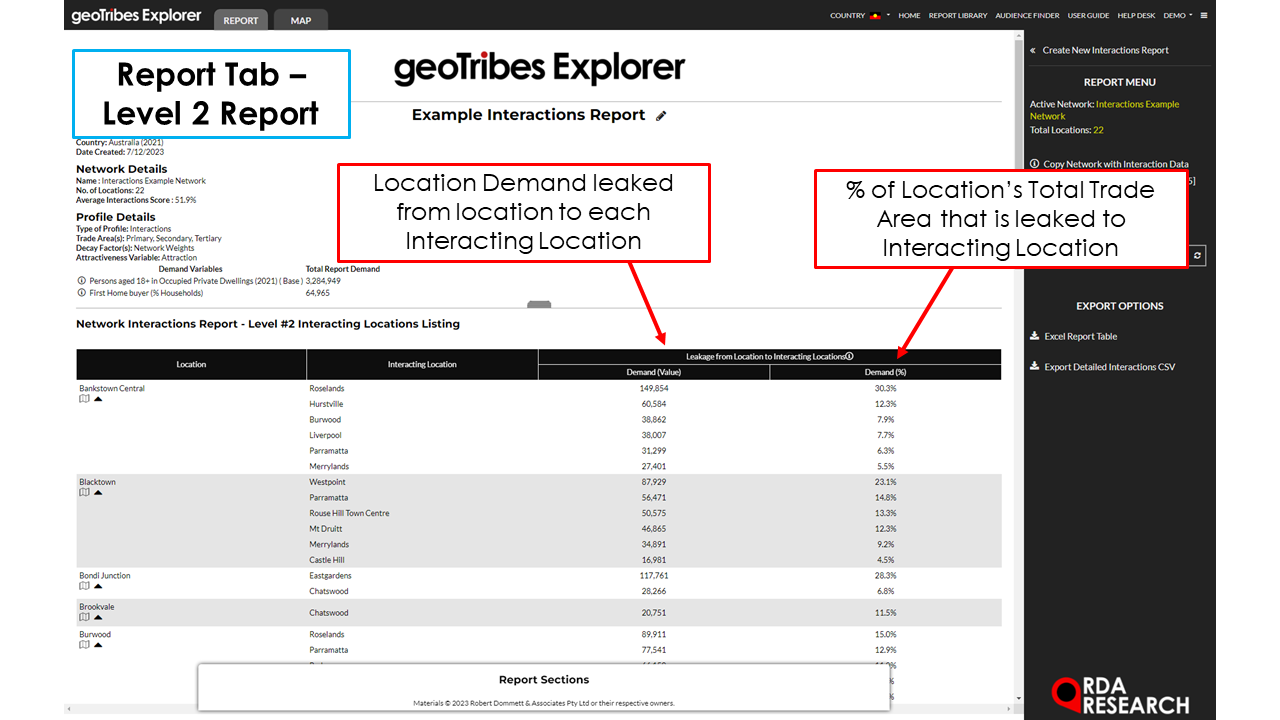
Level 2 - Interacting Locations Listing
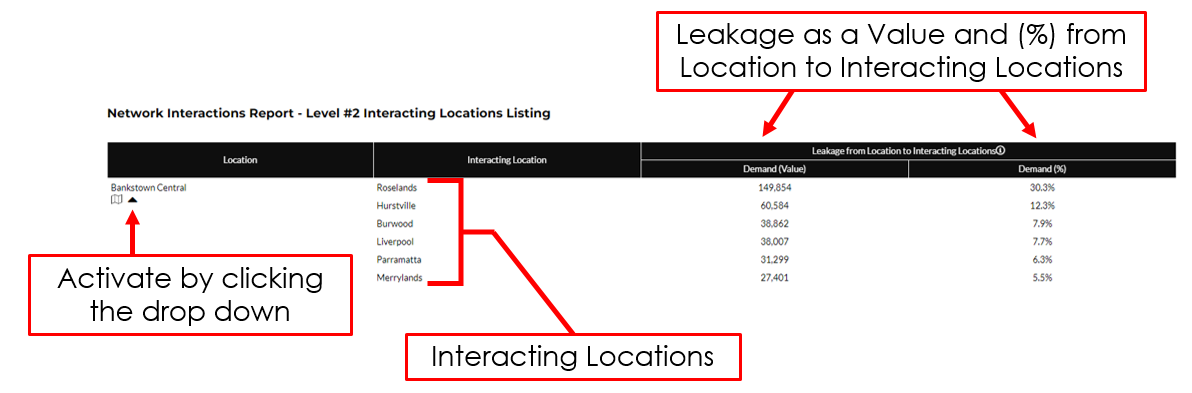
For this level within the Report Tab, all Interacting Locations are listed for each location, where each row represents an Interacting Location. For each Interacting Location it provides:
Demand Leakage (Value) from Location to Interacting Location: Provides the Total Trade Area Demand that is assigned to the Interacting Location.
Demand Leakage (Share) from Location to Interacting Location: Provides as a % the Total Trade Area Demand assigned to the Interacting Location.
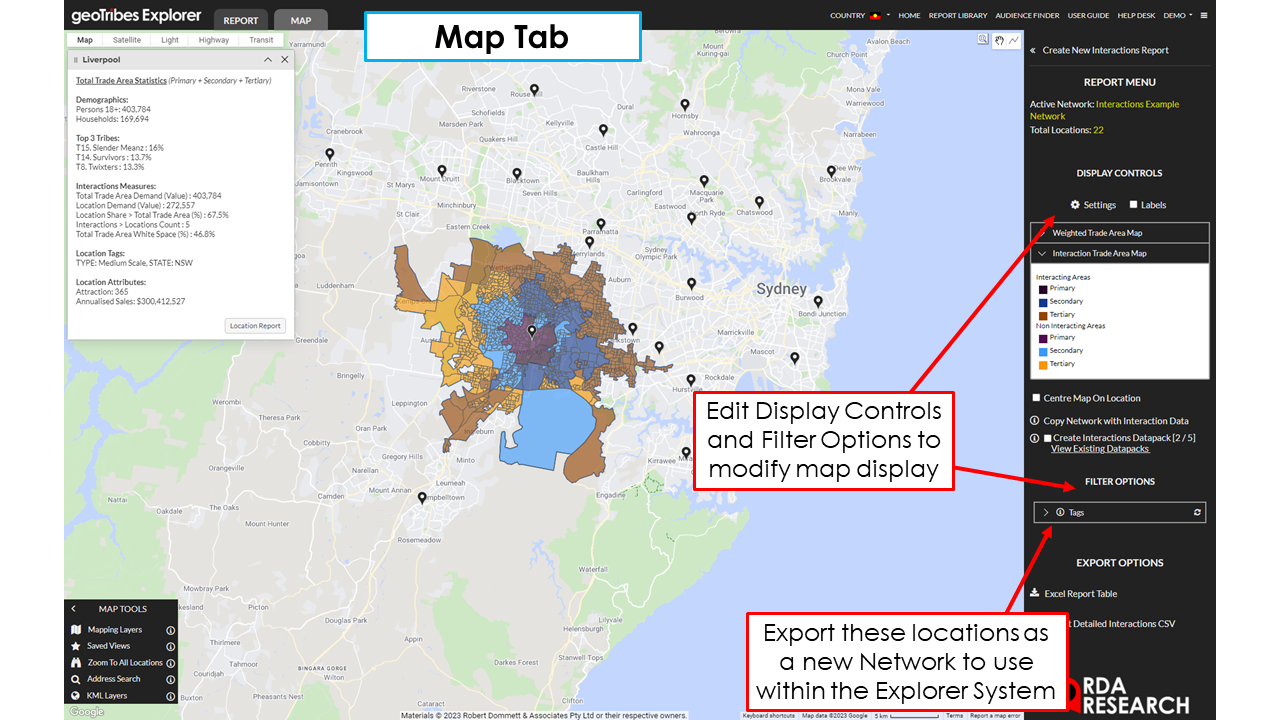
Additional Features within Interaction Reports:
Filter Options: Users can use Tags or the Search Bar for locations of interest.
Demand Summary: Displays a summary of Total Demand within the Network for the Base Layer and any assigned Reporting Variables. This table is responsive to any Filtering done within the Report.
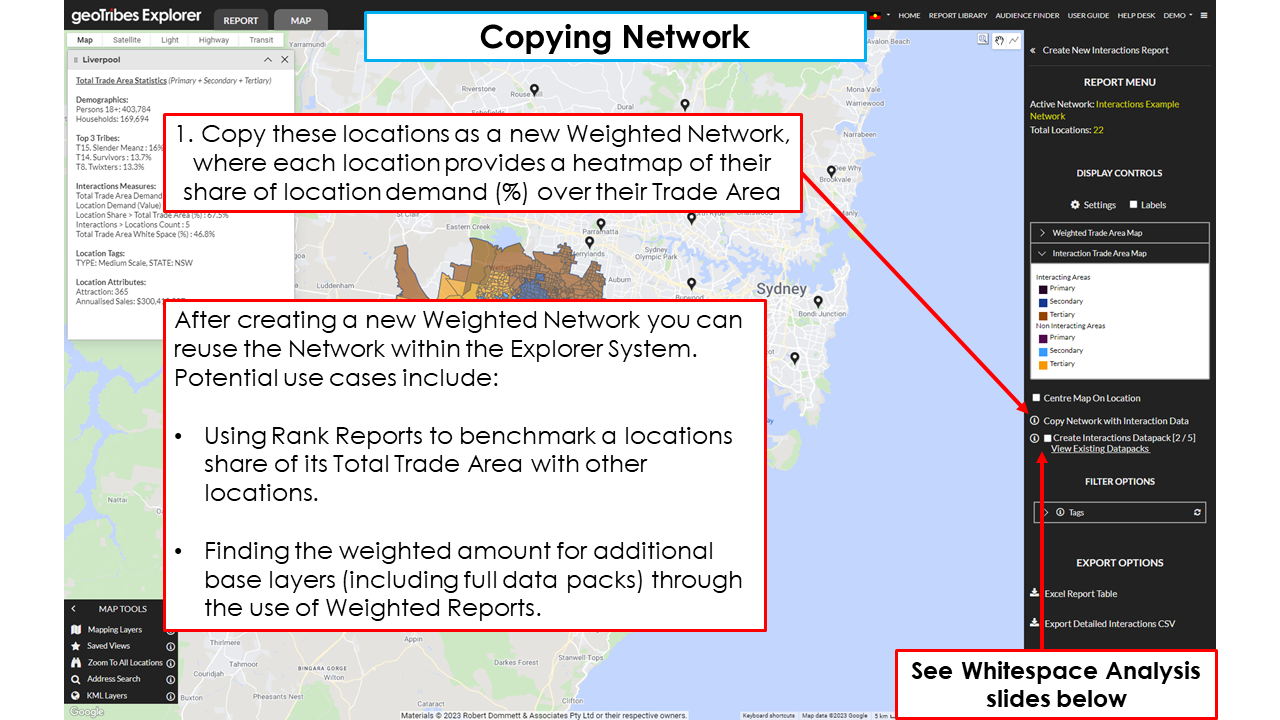
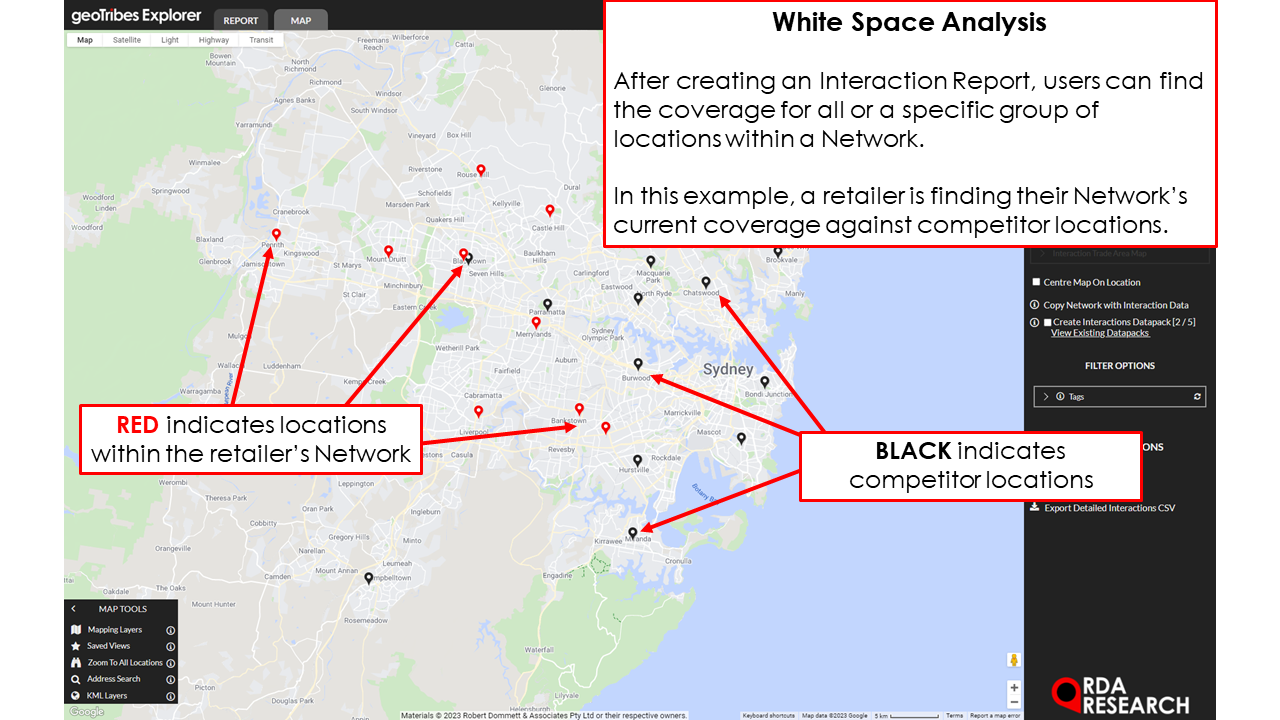
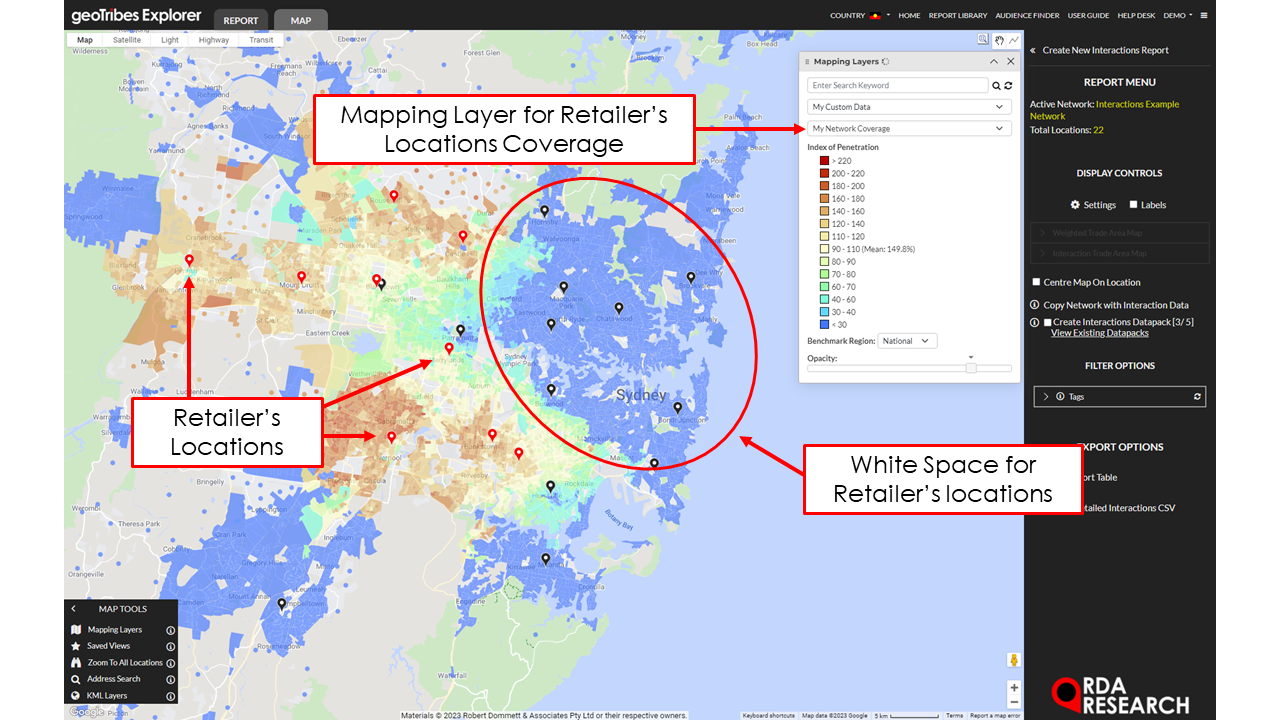
Producing a Datapack - White Space Analysis
White Space Analysis allow users to export the coverage for a selection or all locations as a mapping layer within Explorer. This can enable quick easy analysis in finding high potential locations of opportunity to expand a Network’s coverage.

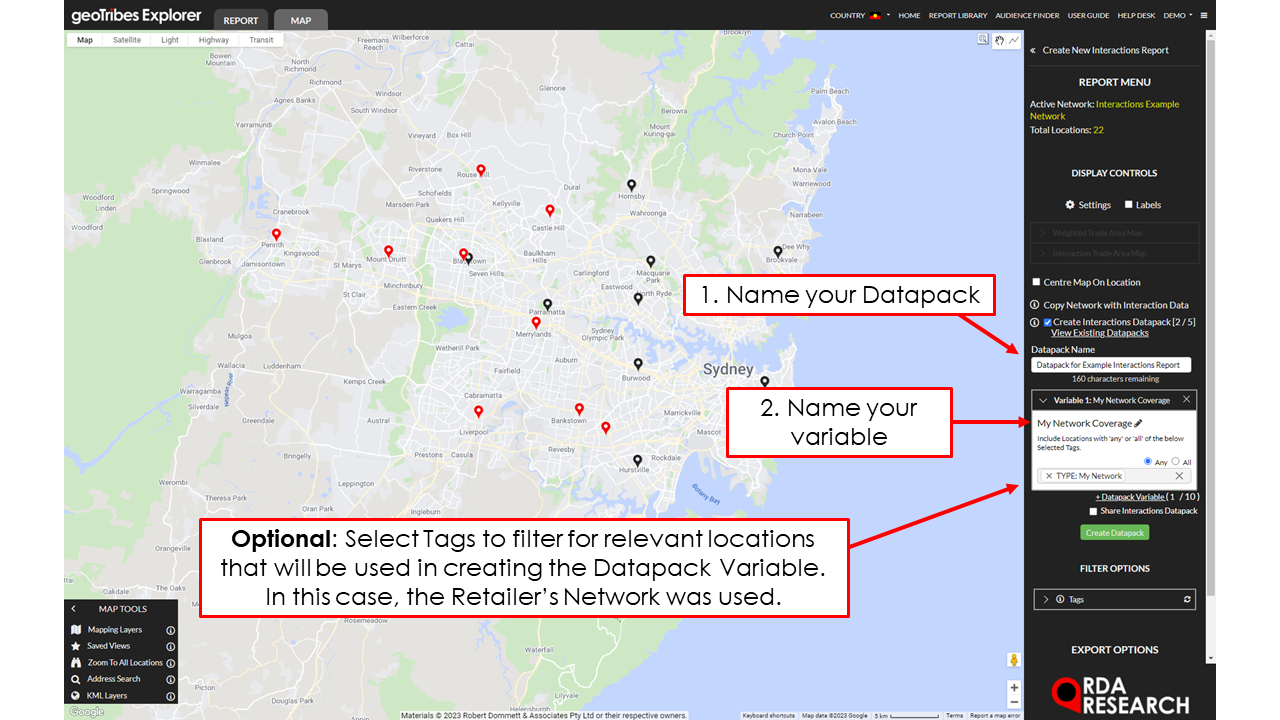
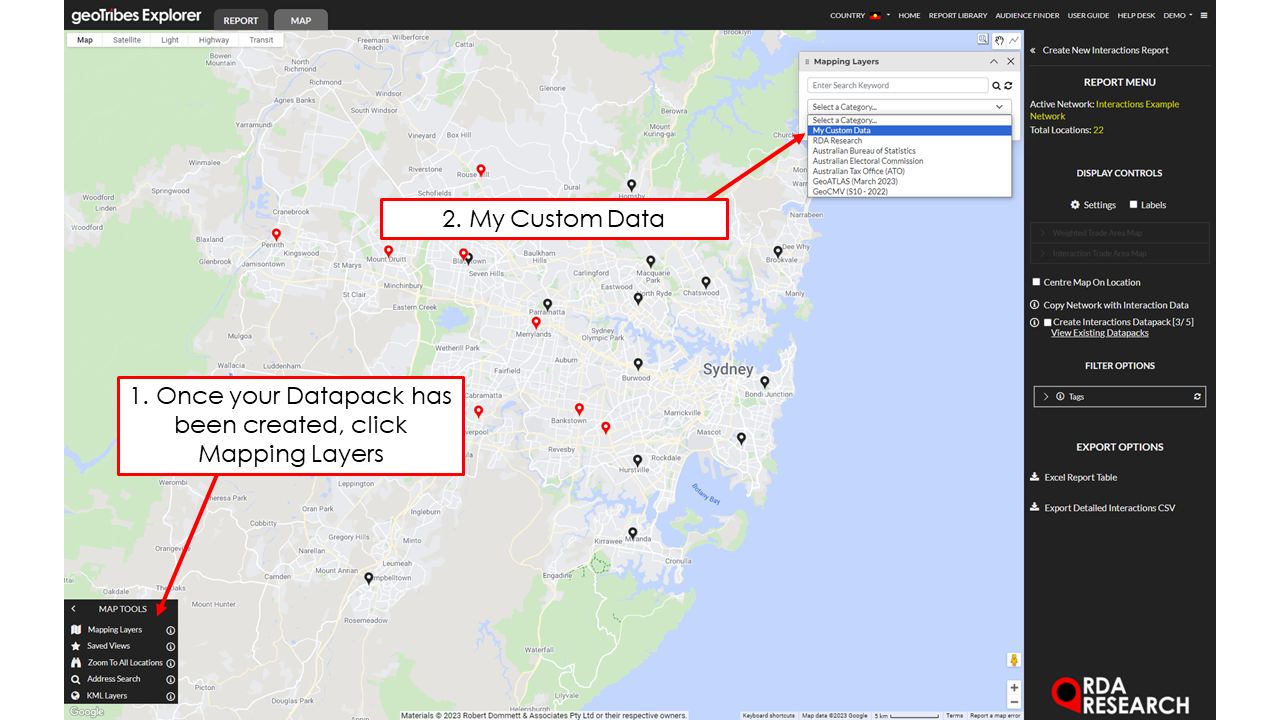

To export a Datapack:
Check on “Create Interactions Datapack” in the RHS menu.
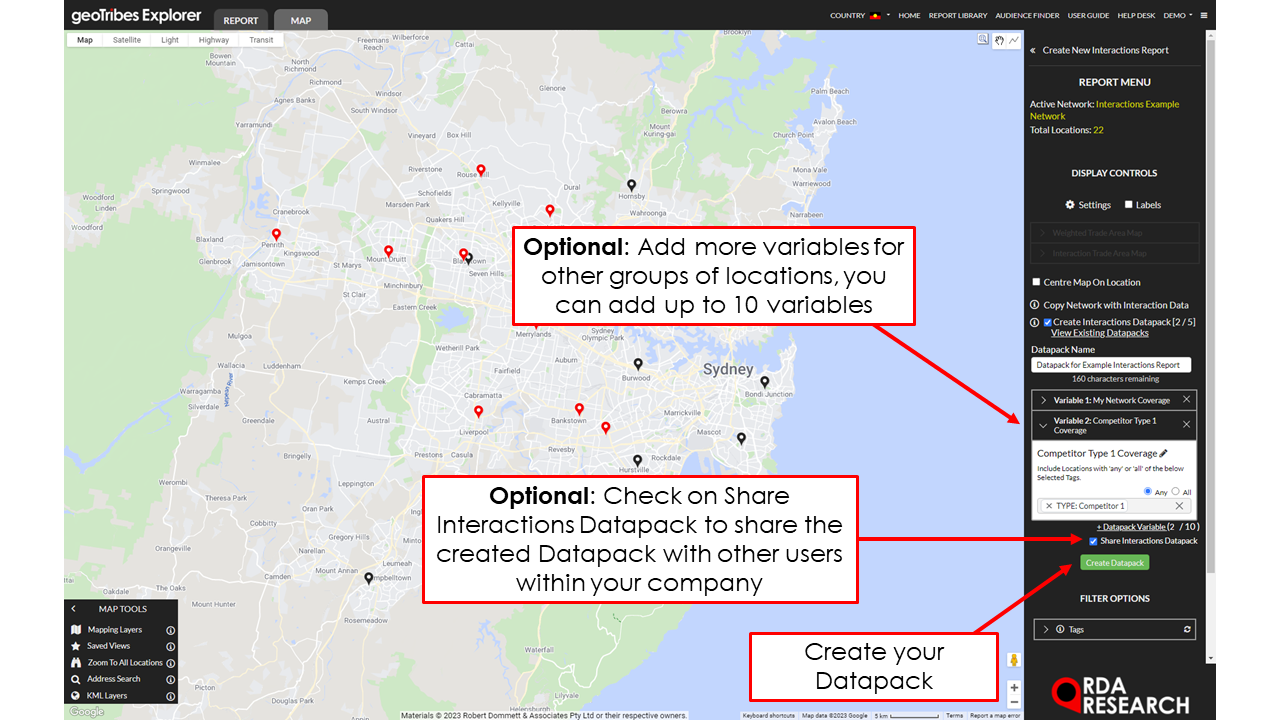
Name your Datapack, then for each variable:
Name your variable
Assign locations with your variable using TAGS
Select Create Datapack.
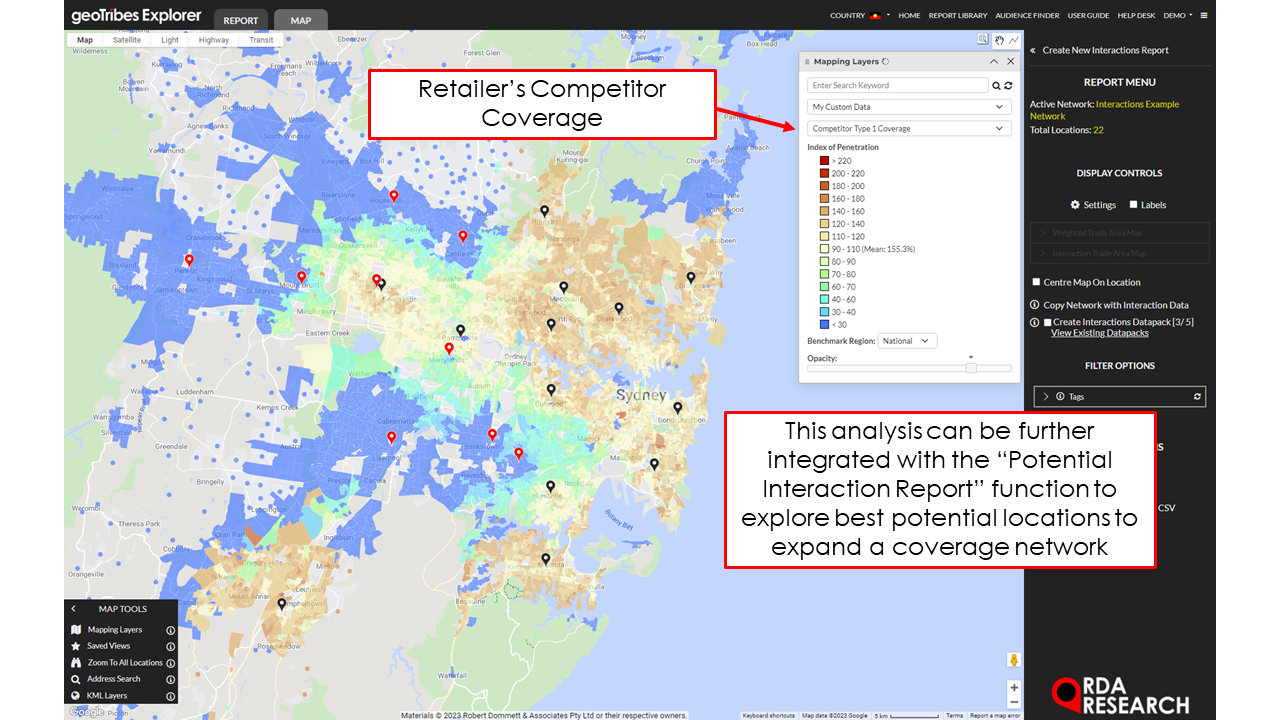
After creating a datapack, users can integrate this analysis with the “Potential Interaction Report”, which enables users to ascertain potential Network cannibalisation and impact on Competitor Locations.
Export
'Excel Report Table' creates an Excel spreadsheet of all the Report Tables.
‘Detailed Interactions CSV’ creates an Excel spreadsheet with a detailed break down of each locations trade area demand for each census area.
‘Copy Network With Interaction Data’ creates a new network, updating each location’s attributes with the trade area data created from the report.
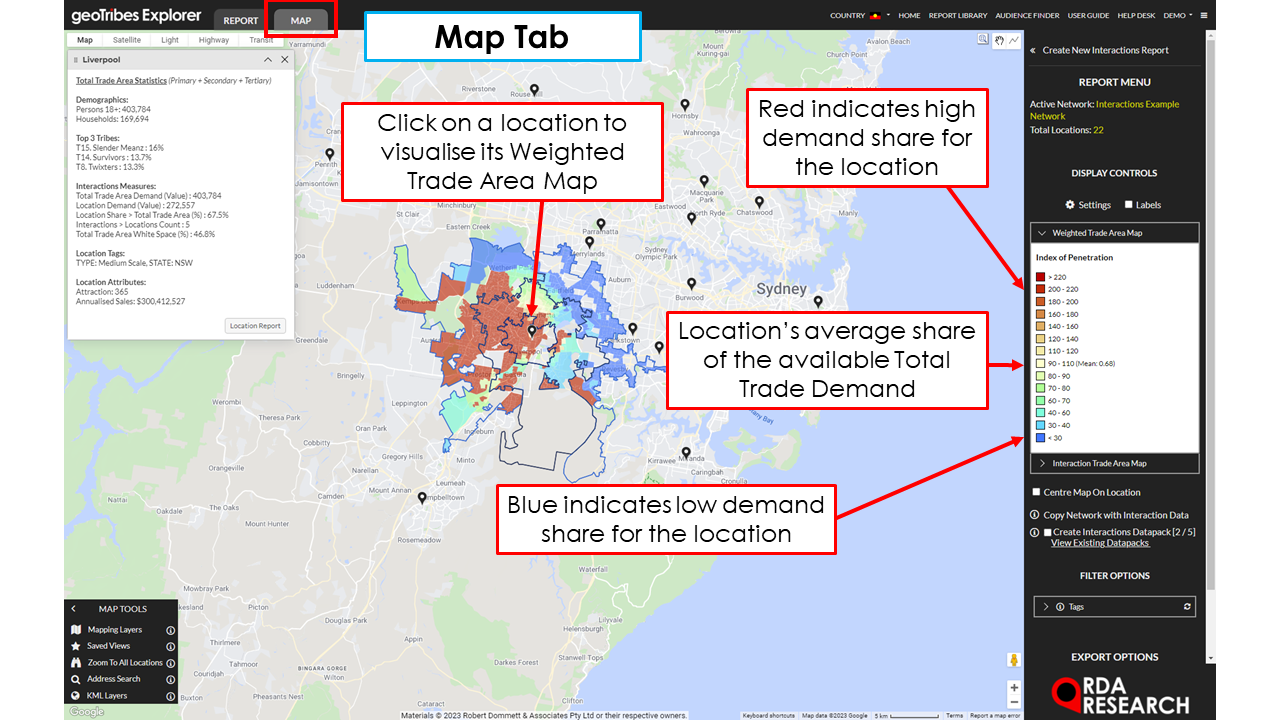
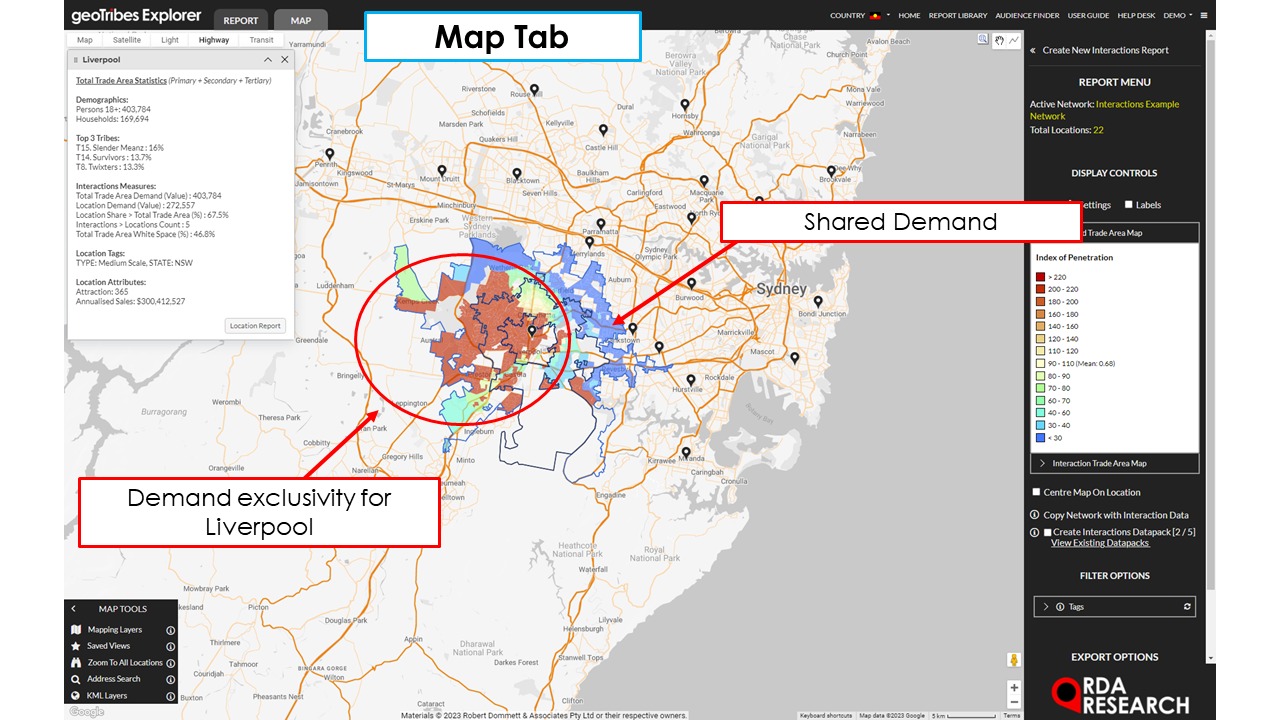
‘Save as Weighted Network’ enables users to view location’s trade areas as an index of its the demand it controls in its trade area relative to competitors. This can be accessed by clicking on an individual location’s icon on the map.
‘Create Interactions Datapack’ allows users to extract the brand share for tagged locations at an SA1 level and turn it into a data pack of variables for use in the Explorer’s analytical functions.