Reports: Rank Report
Rank Reports provide users the ability to profile all locations within a Network on up to 200 data pack variables, with extended functionality to filter locations and perform scatter plots. With these features users can perform analyses such as:
Finding locations which satisfy multiple rule and criteria, i.e. top 50 locations within a 2km proximity to a Passive Network which over index on a user defined audience
Implement strategic frameworks to assess against i.e. benchmarking performance of locations against several measures.
After performing these functions users can then export data from the Explorer to be used for inhouse analysis.
Create Rank Report


Open the Network to perform the Rank Report on.
Select “Create Reports” then “Rank”.
Follow the on-screen instructions to set the Report details:
Rename the Report under “1. Title Report” for ease of access in the “Report Library”
Select the data pack of choice by clicking on “Datapacks of Variables” this will then present the categories of data packs.
Choose which variables are necessary for the report once finding the relevant pack.
If needing only a few select variables users can search for the variables individually by clicking on the drop down menu and clicking on the select variable, submit this by selecting “Add Individual Variable.”
If users need multiple variables for comparison, it can be easier to use the “Add whole Datapack” when adding variables, this will add the whole pack at once.
Users can select up to 200 variables when creating a report.
Select “Create New Report” once selecting variables.
Filter Options


Filters control which locations are displayed in the Report, Map and Plot Tabs by creating a selection.
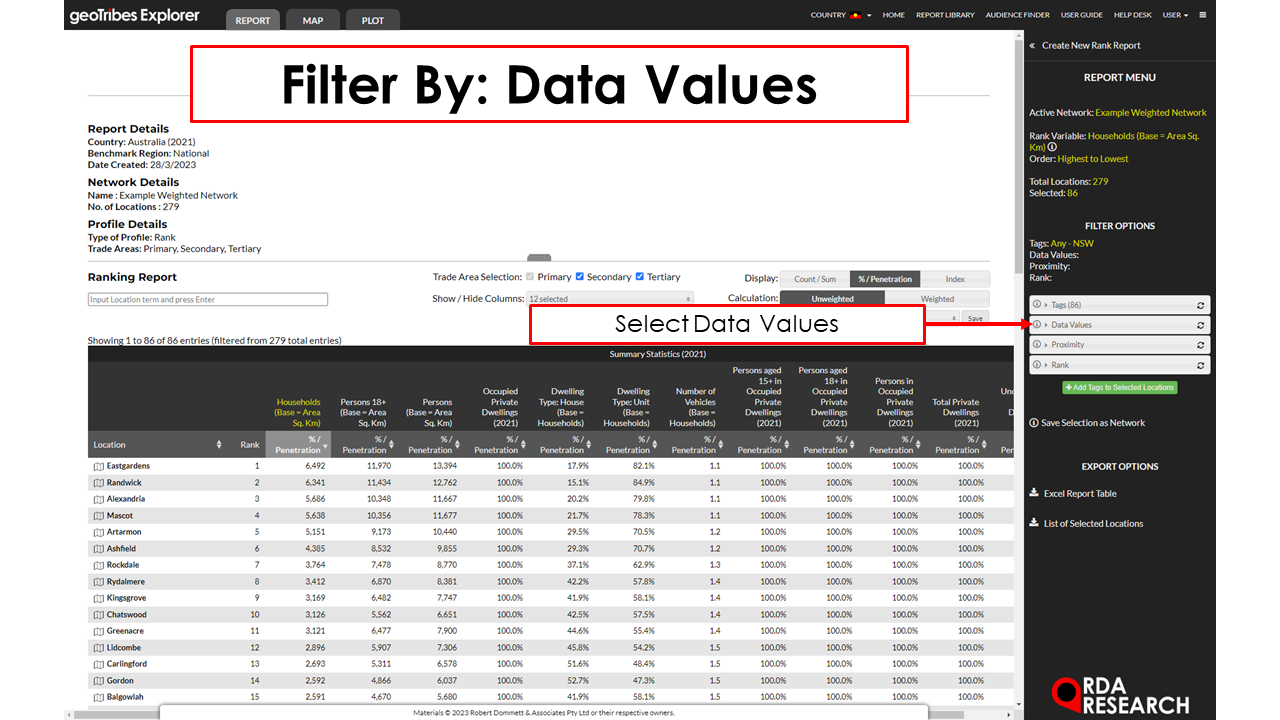
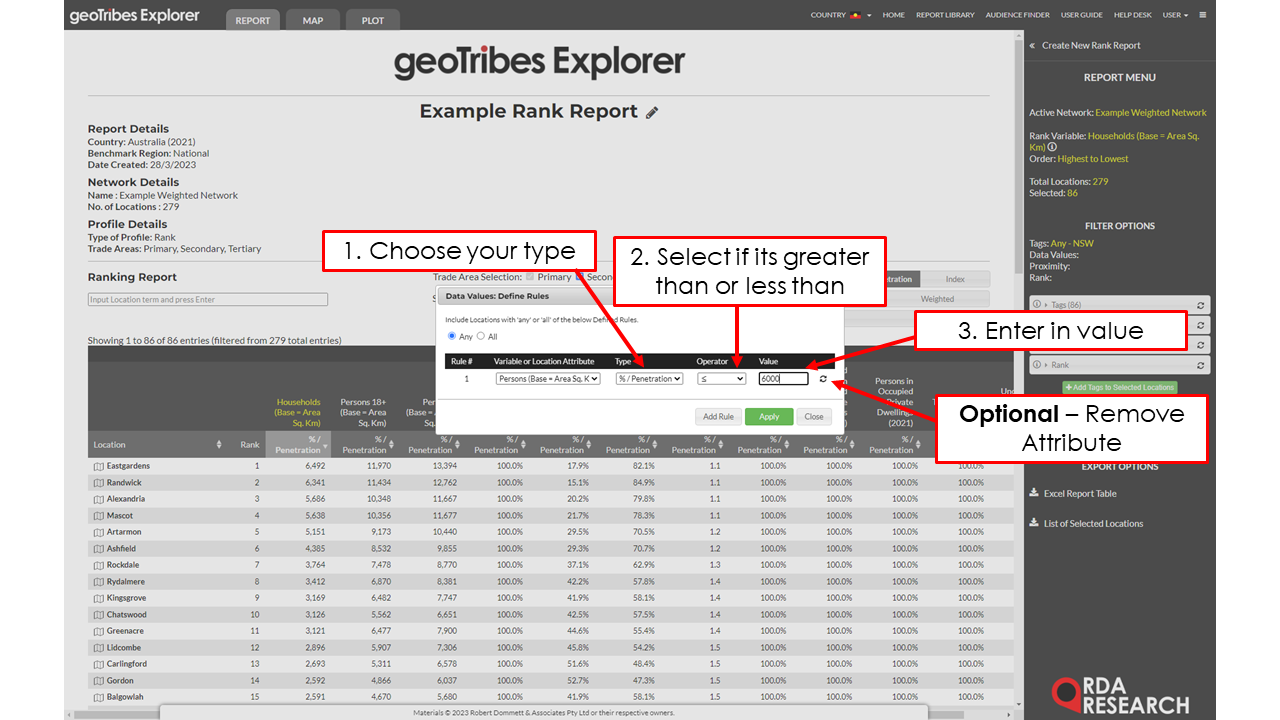
Within each Filter control, set a rule and click 'Apply' for the Report to update. When a Filter is applied, the details will be listed in yellow text above in the Report Menu. If an amendment is made to a Filter but 'Apply' is not clicked, the filter option will be labelled as “Pending”.
Tags: Select which locations to include based on their Location Tags. Use 'Any' for locations that have any of the Tags selected or 'All' for locations with all of the Tags selected. By default all Tags are included and therefore all locations selected.
Data Values: Filter locations based on the values in the Report Table, using Count/Sum, %/Penetration and Index, and a range of operators. Use 'Any' or 'All' to the same effect as above.
Proximity: Filter locations based on whether they are inside or outside a defined distance of one or two Passive Network Locations.
Choose ‘Any' to use Active locations from either Passive Network or 'All' to use only Active locations within both Passive Networks.
The number of selected locations for an individual Passive Network's proximity rule is previewed in the Passive Network's dialogue box, with the result of both proximity and Any/All rule displayed in the Filter name in brackets upon being applied.
Rank: Apply a range selection on locations based on their ranking.
The green ‘Add Tags to Selected Locations’ button can be used to assign a Network Tag to the group of locations which have been defined by the filters selected.
- The Filters are sequentially connected, with each Filter controlling which Locations are then available for the following Filter selection. This means 'Tags' control which Locations the 'Data Values' Filter will be applied to, and the combination of 'Tags' and 'Data Values' Filters control which Locations the 'Rank' is applied to. This means that between Filters an 'and' conjunction is used.
- The Filters display their resulting Location count in brackets, and is also based on the prior selections as explained above.
Report Tab


The Report Table compares the Location Trade Area value (rows) for each of the included Data Pack Variables or Location Attributes (columns), as either Count, Penetration or Index Score. The column highlighted in yellow represents the ranking variable and can be changed by clicking on the sort icon below the columns name (this can also be used to sort high to low or vice versa).
Features
Trade Area Selection: Choose the Trade Area for all locations with which the Rank Report will be calculated on.
Show/Hide Columns: Filter irrelevant columns to view data packs easier.
Display: Change Display to 'Count', '% / Penetration' or 'Index' Scores.
Calculation: Only available for weighted networks. Selected Weighted to use the weights from the location to calculate the values within the report.
Report Filters: Applied Report Filters will adjust the contents of the Report Table.
Rank: Rank locations within the report table, based on the selected ranking variable and any filters applied. The location’s rank can be found to the right of the Location names. Any changes to Trade Area Selection, Display or Calculation will affect the rank of a location.
Map Tab


The Report Map displays the selected Locations from the Report Table (and are hence also controlled by the Filters).
Features
Display Controls: Edit Icons and Settings, Read more here.
Ranking: Check on “Ranking” to see all locations with a rank number next to their location, this number is derived from the sorted variable in the Report Tab.
All locations: View all locations in the Network even if they have been filtered (this does not affect the report table and filters applied to it).
Select Multiple Locations: Select Multiple Locations to view their Trade Areas and Labels, read more here.
Search Points of Interest: Search a selected locations Points of Interest, read more here.
Plot Tab


The Plot Tab allows users to create a Scatter Plot of filtered locations based on user selected variables for the X and Y Axes. These axes can be based on any of the Data included in the Report as either Count, Index or Penetration values of Variables, or Location Attributes.
Features - Configure Plot:
Select X-Axis: Assign the Report's data variables to be used as the X-Axis (Horizontal axes of the chart). If this is a data pack variable users can select between using the Count, Penetration or Index for this variable. If using a Location Attribute this does not need to be defined.
Select Y-Axis: Same as with X-Axis .
Select Dot Size: Set a fixed size for the dots or make the dot size dependent on a data variable in the Report Table.
Select a Dot Colour by Tag: Colour the dots by assigning a colour to Location Tags.
Insert a Trendline: Fit the line of best fit for the scatter plot.
Features - Plot Interaction:
Click the dots to view the Location Names.
Double-click dots to automatically jump to the Location in the Report Map.
Click on the Trendline to view the equation and r-squared value for the fitted line.
Export
There are a range of options within the Rank Report Menu for exporting the selected Network Locations based on the Filters. These include:
'Excel Report Table' creates an Excel spreadsheet matching the Report Table. This can be for the entire Network or the filtered selection.
'Save Selection as a New Network' creates a new Network from the selected locations.
'Export List of Selected Locations' creates a .txt file listing the selected Locations and their attributes, including Location Name, Tags, Coordinates and Location Attributes.
Inside the Proximity Filter 'Export Location Distances (CSV)' allows users to export a file with the selected Active Locations and their distance to the Passive Network Locations within the applied distance parameter. This is a product of both Passive Network Proximity rules and the 'Any/All' condition.

